Fig. B.1
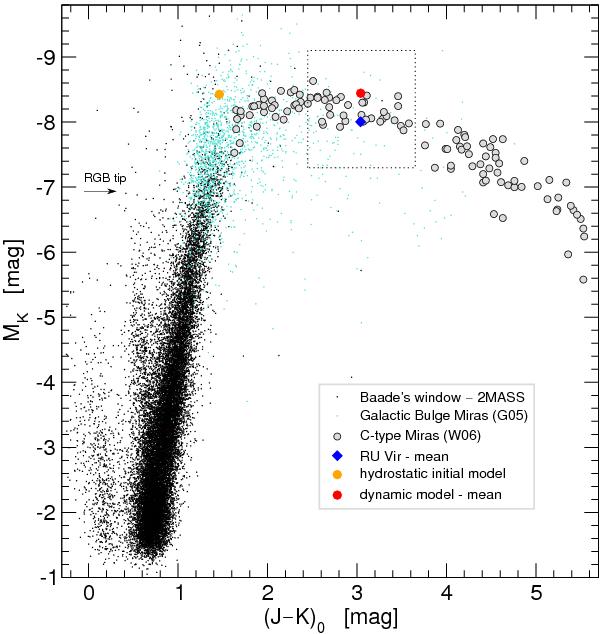
Colour–magnitude diagram containing observational data compiled from different sources: (i) 2MASS photometry of stars in Baade’s window (black dots); (ii) 2MASS photometry of Mira variables in the Galactic bulge (turquoise dots) identified by Groenewegen & Blommaert (2005); and (iii) reddening corrected mean magnitudes and colours of field C-Miras (grey filled circles, blue diamond for the individual RU Vir data) from Whitelock et al. (2006, Table 6) shifted to an absolute scale MK according to the distances given by the same authors. Overplotted are the modelling results for model S, i.e. the location of the hydrostatic initial model as well as the average of several phases of the different cycles in Fig. A.2. The colour-code is the same as in Fig. 16 of Paper II. The box (dotted lines) marks the range covered in Fig. A.2.
Current usage metrics show cumulative count of Article Views (full-text article views including HTML views, PDF and ePub downloads, according to the available data) and Abstracts Views on Vision4Press platform.
Data correspond to usage on the plateform after 2015. The current usage metrics is available 48-96 hours after online publication and is updated daily on week days.
Initial download of the metrics may take a while.