Fig. 12
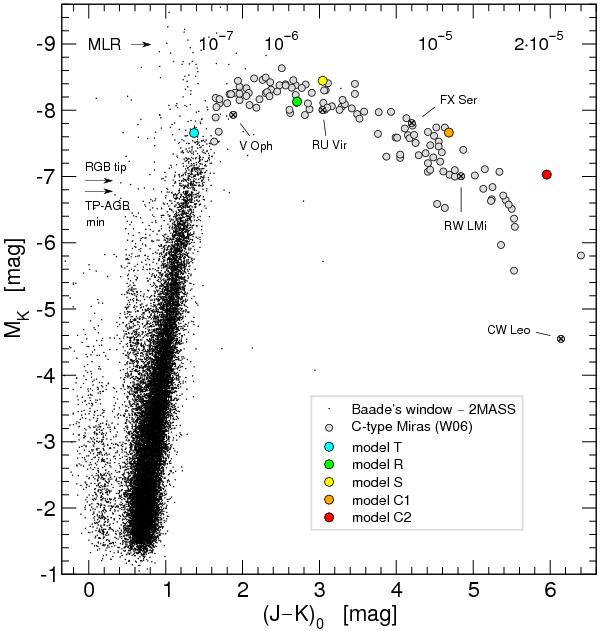
Colour–magnitude diagram of the Galactic bulge objects together with the reddening corrected mean magnitudes and colours of field Carbon Miras from Whitelock et al. (2006, Table 6) shifted to an absolute scale MK according to the distances given by the same authors. Overplotted are the mean colours and magnitudes of the series of dynamical models. Marked are, in addition, the magnitude of the RGB tip estimated by using the empirical relations of Valenti et al. (2004; Eq. (9)) under the assumption of [Fe/H] ≈ 0 for the Galactic bulge (Zoccali et al. 2003), as well as the magnitude of the beginning of the TP-AGB for a solar-like star as given by Marigo et al. (2008). The labels in the upper part mark approximate mass-loss rates Ṁ [M⊙ yr-1] for the C-type Miras of Whitelock et al. (2006) as related to a given (J – K)0 colour in Fig. 7.
Current usage metrics show cumulative count of Article Views (full-text article views including HTML views, PDF and ePub downloads, according to the available data) and Abstracts Views on Vision4Press platform.
Data correspond to usage on the plateform after 2015. The current usage metrics is available 48-96 hours after online publication and is updated daily on week days.
Initial download of the metrics may take a while.