Fig. 11
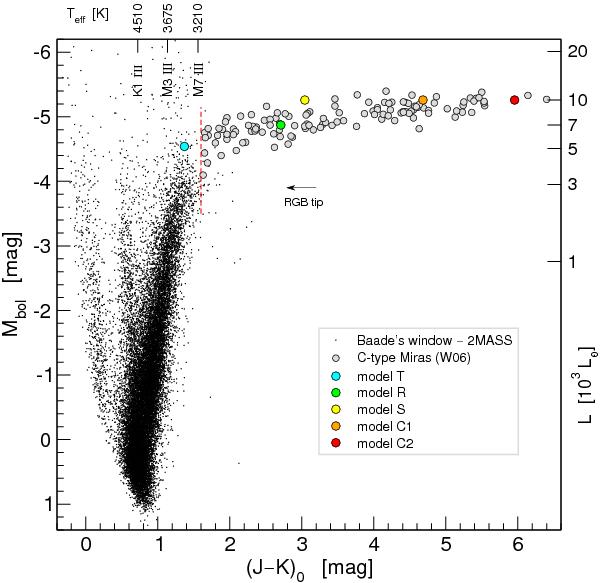
Colour–magnitude diagram containing objects in Baade’s window, the bolometric magnitudes were computed from 2MASS photometry by using the BCK given in Montegriffo et al. (1998). The labels at the top denote effective temperatures and spectral types of late-type giants for a given calibrated colour as listed by Houdashelt et al. (2000, their Table 4). Overplotted are the corresponding data for the galactic C-type Miras of Whitelock et al. (2006) adopted from their Table 6, as well as the results for all atmospheric models investigated here. The vertical dashed line at (J – K) = 1.6 marks approximately the border between the hydrostatic and the dynamic regime for C stars (as discussed in the text).
Current usage metrics show cumulative count of Article Views (full-text article views including HTML views, PDF and ePub downloads, according to the available data) and Abstracts Views on Vision4Press platform.
Data correspond to usage on the plateform after 2015. The current usage metrics is available 48-96 hours after online publication and is updated daily on week days.
Initial download of the metrics may take a while.