Free Access
Fig. 7
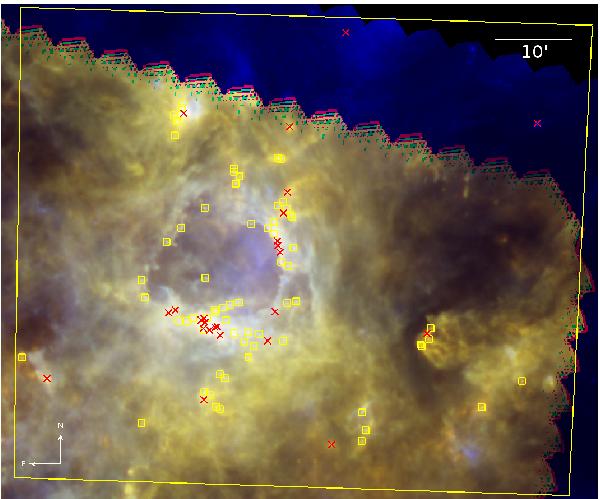
Herschel RGB image (red: 500 μm, green: 250 μm, blue: 70 μm) with positions of all Herschel point-like sources detected in at least two bands overlaid. Red crosses show the position of protostellar, yellow boxes those of prestellar cores. The large yellow rectangle marks the borders of the analysed region.
Current usage metrics show cumulative count of Article Views (full-text article views including HTML views, PDF and ePub downloads, according to the available data) and Abstracts Views on Vision4Press platform.
Data correspond to usage on the plateform after 2015. The current usage metrics is available 48-96 hours after online publication and is updated daily on week days.
Initial download of the metrics may take a while.