Fig. 1
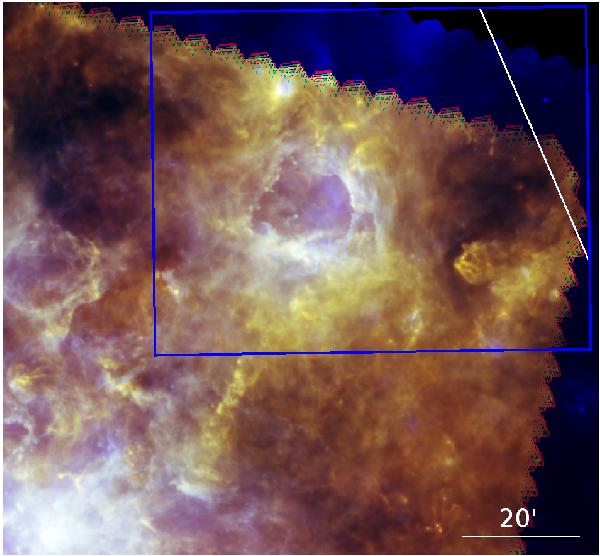
Gum 31 region and its connection to the central Carina Nebula, seen in a Herschel RGB image, with the PACS 70 μm image in blue, SPIRE 250 μm in green, and SPIRE 500 μm in red. The blue box marks the 1.1° × 1.0° area used for analysis here. The diagonal white line marks the border to the left of which we obtained IRAC photometric data.
Current usage metrics show cumulative count of Article Views (full-text article views including HTML views, PDF and ePub downloads, according to the available data) and Abstracts Views on Vision4Press platform.
Data correspond to usage on the plateform after 2015. The current usage metrics is available 48-96 hours after online publication and is updated daily on week days.
Initial download of the metrics may take a while.