Fig. 7
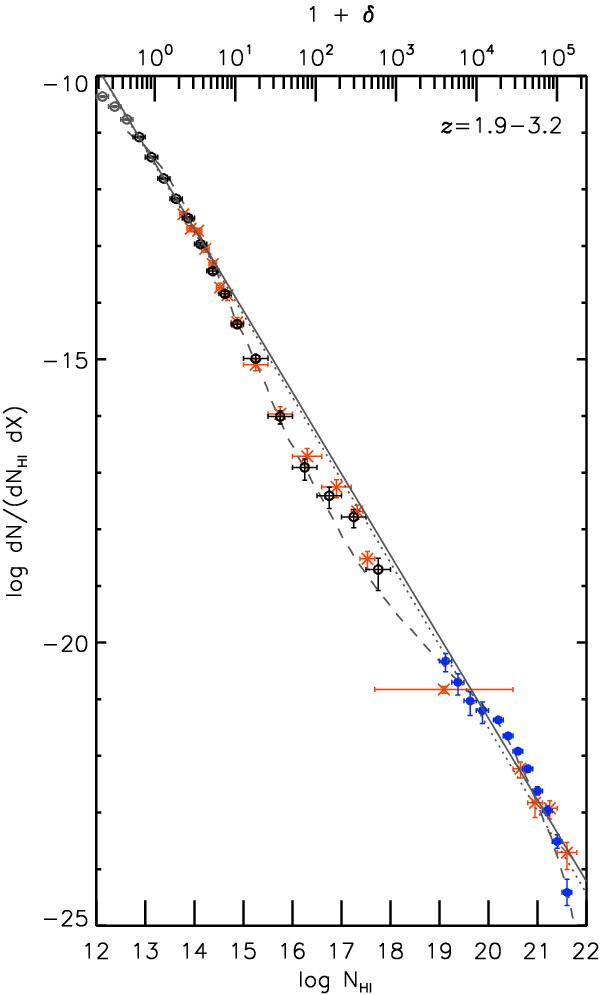
Differential column density distribution at 1.9 < z < 3.2 using the Lyα-only fits. Both black (log NH i ≥ 12.75) and grey (log NH i < 12.75) data points show the results from our quasar sample. The grey data points mark the column densities that are affected by incompleteness. The stars are the data points obtained by Petitjean et al. (1993). The filled circles at log NH i > 20.1 and at 19 < log NH i < 20.1 are from the SDSS II DR7 at ⟨ z ⟩ = 3.02 by Noterdaeme et al. (2009) and from O’Meara et al. (2007) at ⟨ z ⟩ = 3.1, respectively. The solid line gives the power law fit to our data for log NH i = [12.75,14]. The dotted line represent the fit obtained by Hu et al. (1995), while the dashed line represents a theoretical prediction at z ~ 3 by Altay et al. (2011). The vertical error bars indicate 1σ Poisson errors, while the x-axis error bars show the NH i range covered by each data point. Gas overdensities on the top x-axis are computed using Eq. (10) from Schaye (2001) at z = 2.55 (see text for details).
Current usage metrics show cumulative count of Article Views (full-text article views including HTML views, PDF and ePub downloads, according to the available data) and Abstracts Views on Vision4Press platform.
Data correspond to usage on the plateform after 2015. The current usage metrics is available 48-96 hours after online publication and is updated daily on week days.
Initial download of the metrics may take a while.