Fig. 19
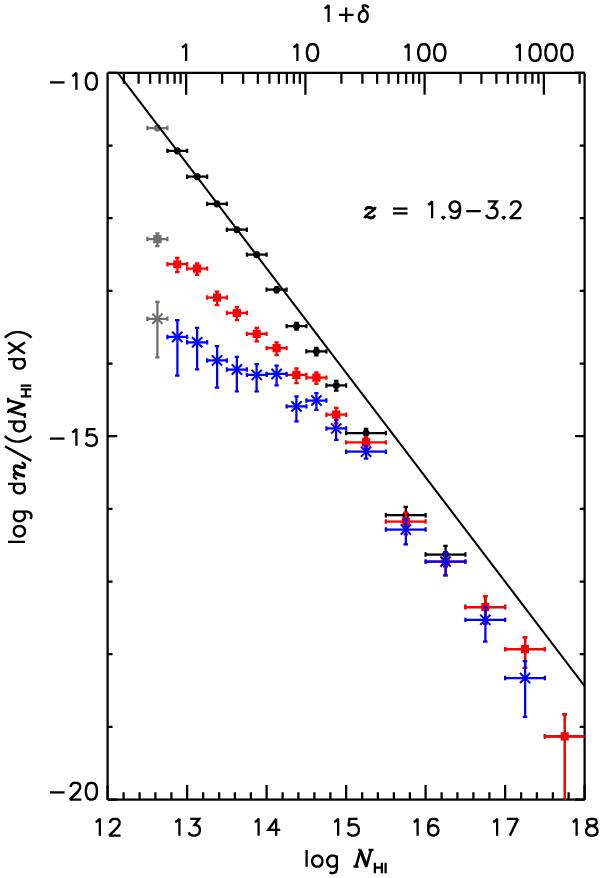
Distribution function for C iv-enriched H i lines for ΔvC iv = ±100 km s-1 (red filled squares) and for ΔvC iv = ±10 km s-1 (blue stars) at 1.9 < z < 3.2. Also shown is the differential column density distribution function for all H i Lyα absorbers excluding Q0055−269 and J2233−606 (black filled circles) in the same redshift range analysed for the C iv-enriched forest. The solid line indicates the fit to filled circles for log NH i = [12.75,14.0]: log dN/(dNH idX) = (7.43 ± 0.44) + (−1.44 ± 0.03) × log NH i. The vertical errors indicate 1σ Poisson errors, while the x-axis error bars show the NH i range covered by each data point. All the grey data points indicate that the data are incomplete at log NH i < 12.75.
Current usage metrics show cumulative count of Article Views (full-text article views including HTML views, PDF and ePub downloads, according to the available data) and Abstracts Views on Vision4Press platform.
Data correspond to usage on the plateform after 2015. The current usage metrics is available 48-96 hours after online publication and is updated daily on week days.
Initial download of the metrics may take a while.