Fig. 17
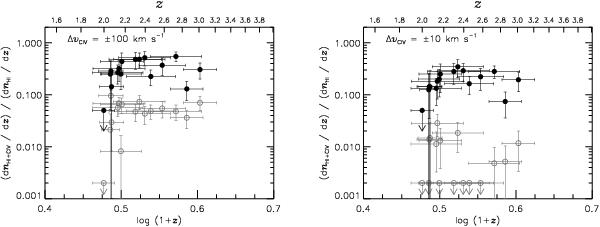
Fraction of the C iv-enriched H i absorber number density to the total absorber number density as a function of redshift. The left panel is derived from the ΔvC iv = ±100 km s-1 sample, while the right panel represents the ΔvC iv = ±10 km s-1 sample. The black open circles represent a column density interval of log NH i = [12.75,14.0] and the filled circles represent log NH i = [14,17]. The vertical error bars mark 1σ Poisson errors, while the x-axis error bars show the redshift range covered by each sightline. In the left panel for log NH i = [12.75,14.0] (gray open circles), two lowest data points at log (1 + z) ~ 0.5 (or z ~ 2) including an upper limit are from Q1101−264 and Q0122−380. Both have a short redshift coverage, therefore become more susceptible to cosmic variance. Sightlines with no C iv-enriched H i absorbers are plotted as upper limits with an arbitrary value of 0.05 and 0.002 for log NH i = [14,17] and log NH i = [12.75,14.0], respectively.
Current usage metrics show cumulative count of Article Views (full-text article views including HTML views, PDF and ePub downloads, according to the available data) and Abstracts Views on Vision4Press platform.
Data correspond to usage on the plateform after 2015. The current usage metrics is available 48-96 hours after online publication and is updated daily on week days.
Initial download of the metrics may take a while.