Fig. 15
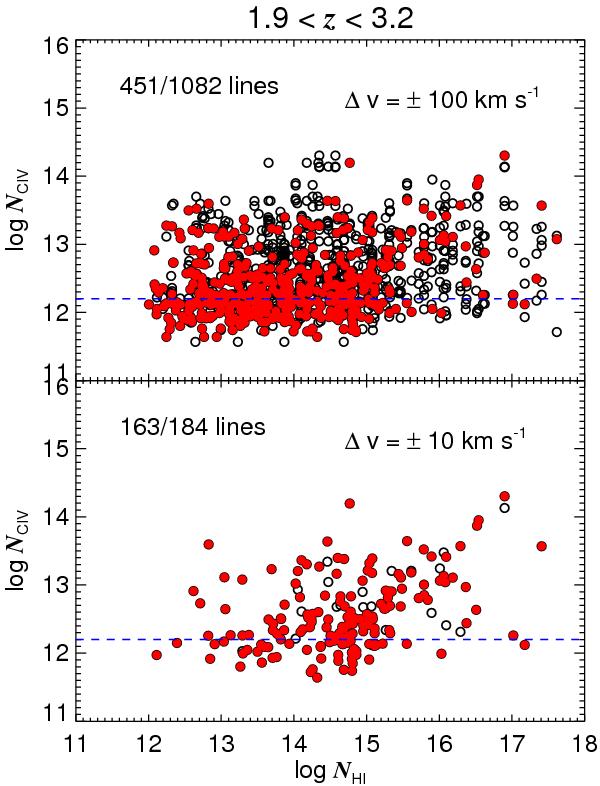
NH i − NC iv diagram for log NH i = [12.0,17.8] from the high-order fit sample at 1.9 < z < 3.2. The upper panel is for the ΔvC iv = ±100 km s-1 sample, while the lower panel for the ΔvC iv = ±10 km s-1 sample. Open circles represent H i absorbers associated with all the possible C iv components, since a single H i line could be assigned to several C iv lines. On the other hand, red filled circles indicate a H i absorber associated with only one closest C iv. The total number of open (filled) circles is 1082 (451) and 184 (163) for the ΔvC iv = ±100 km s-1 and ΔvC iv = ±10 km s-1 sample, respectively.
Current usage metrics show cumulative count of Article Views (full-text article views including HTML views, PDF and ePub downloads, according to the available data) and Abstracts Views on Vision4Press platform.
Data correspond to usage on the plateform after 2015. The current usage metrics is available 48-96 hours after online publication and is updated daily on week days.
Initial download of the metrics may take a while.