Fig. 14
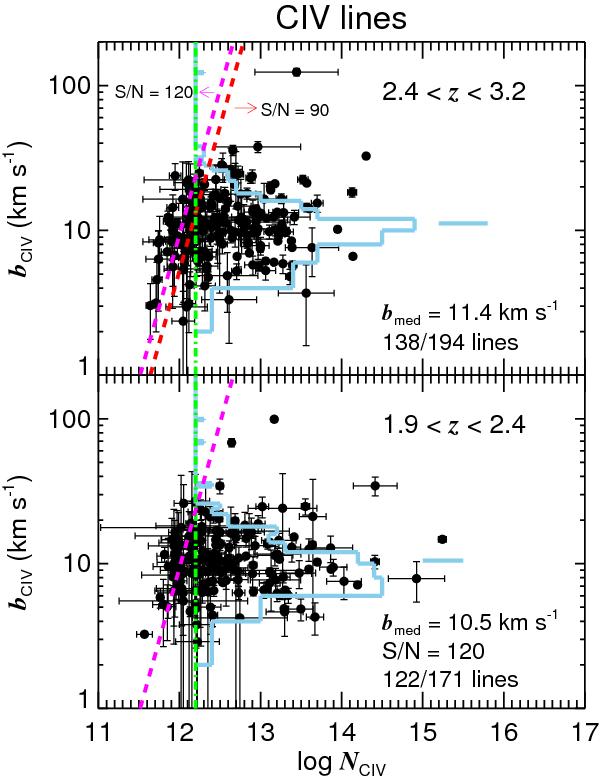
Line width vs. column density for the C iv absorption lines along 16 sightlines excluding Q0055−269 and J2233−606 at the two redshift bins. Error bars are fitting errors from the VPFIT profile fitting. In the upper panel, two heavy dashed lines delineate a 3σ detection limit for a spectrum with S/N = 120 and S/N = 90 per pixel. At 2.4 < z < 3.2, most spectra show S/N greater than 90. In the lower panel, the heavy dashed line shows a 3σ detection limit for S/N = 120. Broader and weaker absorption lines at the left of the detection limit are missed in lower S/N spectra. The vertical dotted line indicates the adopted low NC iv bound of log NC iv = 12.2 above which the incompleteness does not affect the C iv detection significantly. The histogram shown with the base at log NC iv = 12.2 is the number of C iv lines as a function of bC iv with the bC iv binsize of 2 km s-1. Thick ticks above the number distribution mark the median bC iv for log NC iv ≥ 12.2. The total number of C iv lines is 194 and 171 at 2.4 < z < 3.2 and 1.9 < z < 2.4, respectively. Among them, 138 and 122 lines have log NC iv ≥ 12.2 at the same redshift range.
Current usage metrics show cumulative count of Article Views (full-text article views including HTML views, PDF and ePub downloads, according to the available data) and Abstracts Views on Vision4Press platform.
Data correspond to usage on the plateform after 2015. The current usage metrics is available 48-96 hours after online publication and is updated daily on week days.
Initial download of the metrics may take a while.