Fig. 13
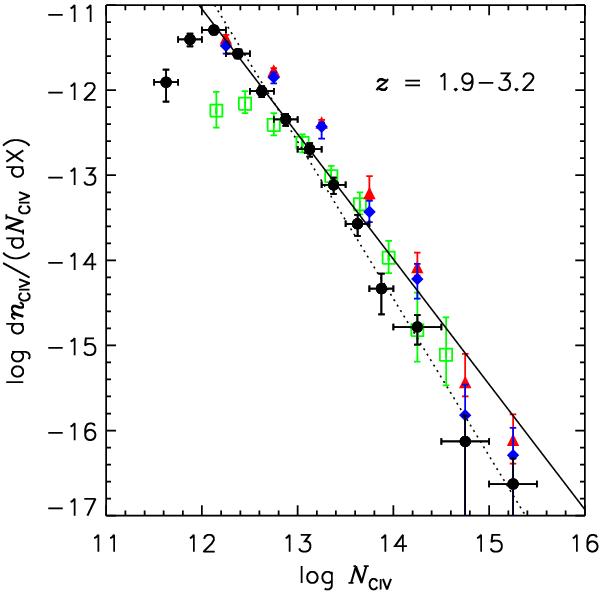
C iv column density distribution. Filled circles are our results at the redshift range used for the high-order fit C iv-enriched H i sample at 1.9 < z < 3.2. The CCD gap in the C iv region was accounted for. Red filled triangles and blue filled diamonds are from Pichon et al. (2003) at 1.5 < z < 2.3 and 2.3 < z < 3.1, respectively. Green open squares are taken from Songaila (2001) at 2.90 < z < 3.54. The vertical error bars indicate 1σ Poisson errors, while the x-axis error bars show the NH i range covered by each data point. The black dotted line shows the linear regression to filled circles at log NC iv = [12.25,15.5]: log dnC iv/(dNC ivdX) = (11.41 ± 1.61) + (−1.85 ± 0.13) × log NC iv. The solid line is the power law fit at log NC iv = [12.25,13.5]: log dnC iv/(dNC ivdX) = (6.60 ± 1.23) + (−1.47 ± 0.10) × log NC iv. The turn-over at log NC iv ~ 12.5 shown in green data is simply due to the incompleteness for weak C iv. Similarly, the turn-over seen at log NC iv ~ 12.1 in our data is also due to the incompleteness.
Current usage metrics show cumulative count of Article Views (full-text article views including HTML views, PDF and ePub downloads, according to the available data) and Abstracts Views on Vision4Press platform.
Data correspond to usage on the plateform after 2015. The current usage metrics is available 48-96 hours after online publication and is updated daily on week days.
Initial download of the metrics may take a while.