Fig. 12
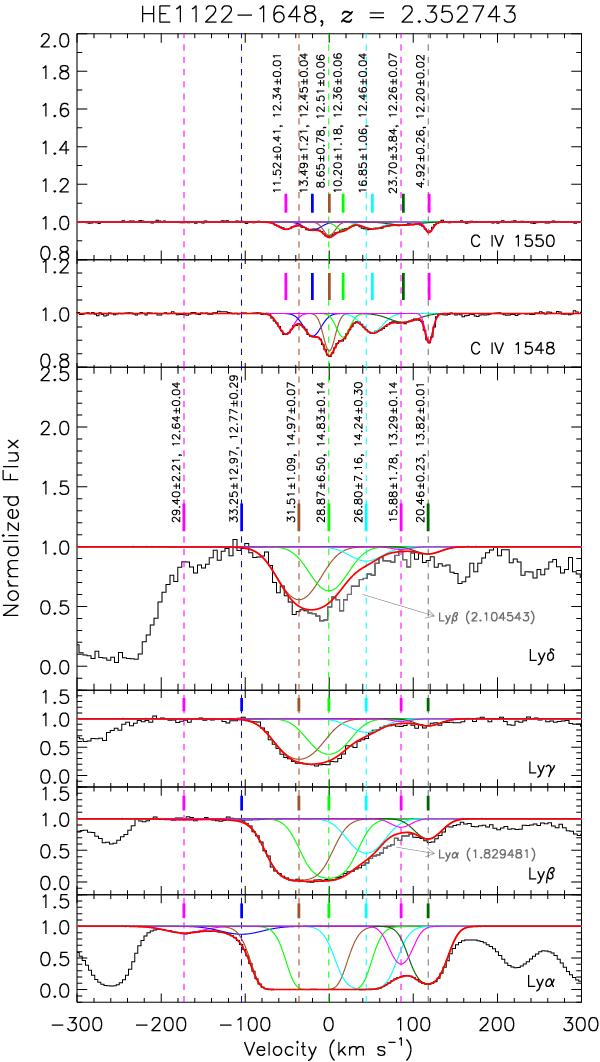
Example of a velocity plot (a relative velocity vs normalised absorption profile plot) of H i and associated C iv detected in the z = 2.352743 absorber in the spectrum of HE1122−1648. The strongest C iv component is set to be at the zero velocity. The observed spectra are plotted as a histogram, while Voigt-profile fits are as a smooth curve. Thick red curves are the combined fit from individual components. The heavy tick marks above the profiles indicate the velocity centroid of each component. Non-negligible blends by other ions are indicated in gray. The b value (in km s-1) and log NH i with the VPFIT fitting errors are displayed next a tick mark indicating the center of the component.
Current usage metrics show cumulative count of Article Views (full-text article views including HTML views, PDF and ePub downloads, according to the available data) and Abstracts Views on Vision4Press platform.
Data correspond to usage on the plateform after 2015. The current usage metrics is available 48-96 hours after online publication and is updated daily on week days.
Initial download of the metrics may take a while.