Fig. 9
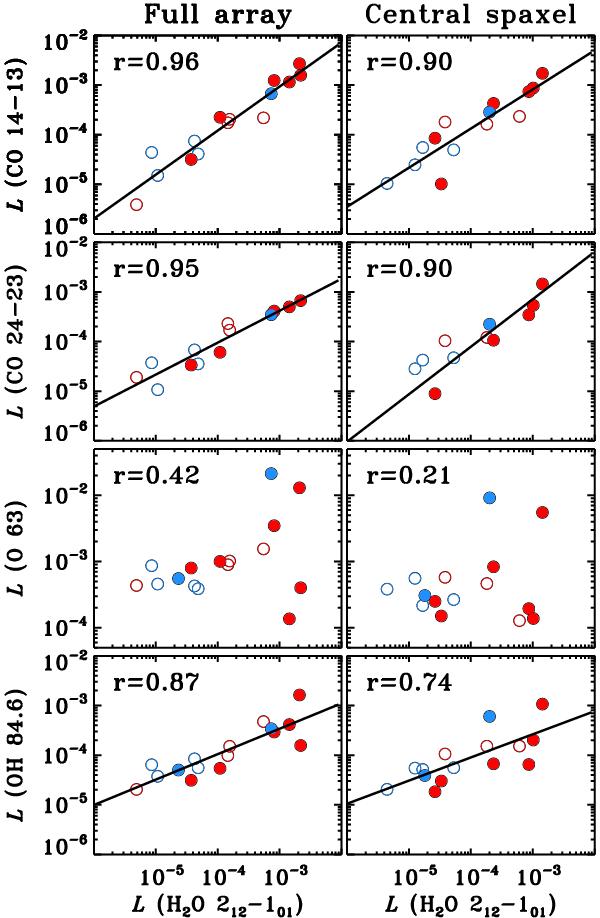
Luminosity correlations between the H2O 212–101 line at 179.527 μm and (from top to bottom) CO 14–13, CO 24–23, [O i] at 63.18 μm, and OH at 84.6 μm, for 16 out of 18 objects (all luminosities in units of L⊙). Full array and central spaxel luminosities are shown in the left and right columns, respectively. Red circles correspond to Class 0 sources and blue circles to Class I sources. Empty symbols show the compact sources, whereas filled symbols denote the extended sources. The Pearson coefficient of the correlation (r) is shown.
Current usage metrics show cumulative count of Article Views (full-text article views including HTML views, PDF and ePub downloads, according to the available data) and Abstracts Views on Vision4Press platform.
Data correspond to usage on the plateform after 2015. The current usage metrics is available 48-96 hours after online publication and is updated daily on week days.
Initial download of the metrics may take a while.