Fig. 7
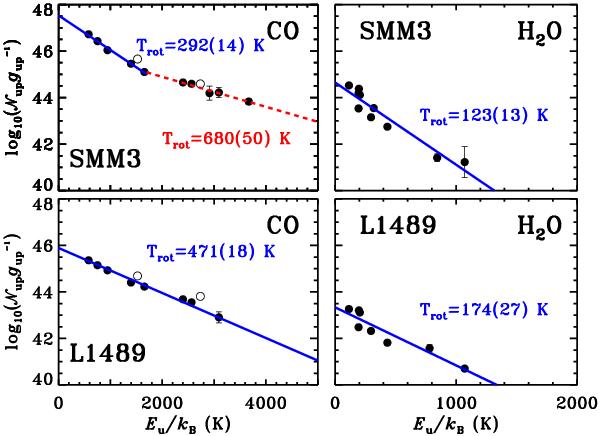
CO (left panel) and H2O (right panel) rotational diagrams for Ser SMM3 (Class 0) and L1489 (Class I) calculated using the total flux in lines measured in the PACS field-of-view. The base 10 logarithm of the number of emitting molecules from a level u,  , divided by the degeneracy of the level, gu, are written on the Y-axis. Two-component fits in the CO diagrams cover the transitions below and above Eu/kB ~ 1700 K (CO 24–23) for the “warm” and “hot component” (see text). Each data point corresponds to one observed transition of a molecule. The limited number of lines observed in the line spectroscopy mode is responsible for the gaps in the otherwise linearly spaced CO diagrams. The error bars reflect the uncertainties in the fit.
Current usage metrics show cumulative count of Article Views (full-text article views including HTML views, PDF and ePub downloads, according to the available data) and Abstracts Views on Vision4Press platform.
Data correspond to usage on the plateform after 2015. The current usage metrics is available 48-96 hours after online publication and is updated daily on week days.
Initial download of the metrics may take a while.