Fig. 5
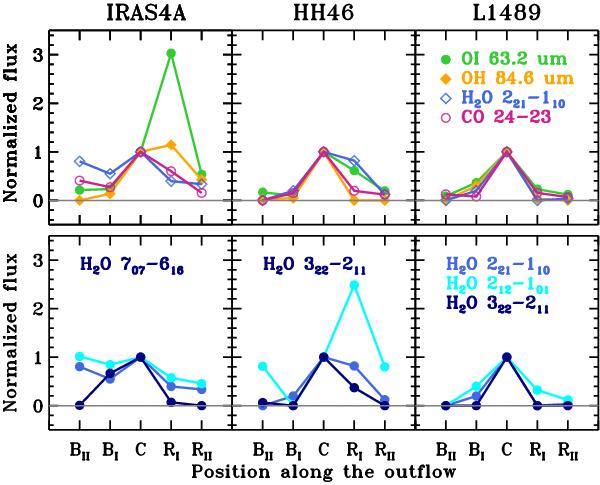
Extent of line emission along the outflow direction for the selected molecular and atomic lines. Top panel: the [O i] 63.2 μm line (green filled circles), the OH 84.6 μm line (orange filled diamonds), the H2O 221–110 line at 108 μm (blue empty diamonds), and the CO 24–23 line (violet empty circles) are shown for each object. Bottom panel: the H2O 221–110 line at 108 μm (blue), the H2O 212–101 line at 179 μm (light blue) are shown for all objects. Additionally, the H2O 716−607 line at 71.9 μm is shown for IRAS4A and the H2O 322−211 at 89.9 μm line is shown for HH46 and L1489 (all in navy blue). The X-axis shows the selected spaxel names along the outflow direction (see Fig. 3), whereas the Y-axis shows the flux normalized to the central spaxel (C) value.
Current usage metrics show cumulative count of Article Views (full-text article views including HTML views, PDF and ePub downloads, according to the available data) and Abstracts Views on Vision4Press platform.
Data correspond to usage on the plateform after 2015. The current usage metrics is available 48-96 hours after online publication and is updated daily on week days.
Initial download of the metrics may take a while.