Fig. 3
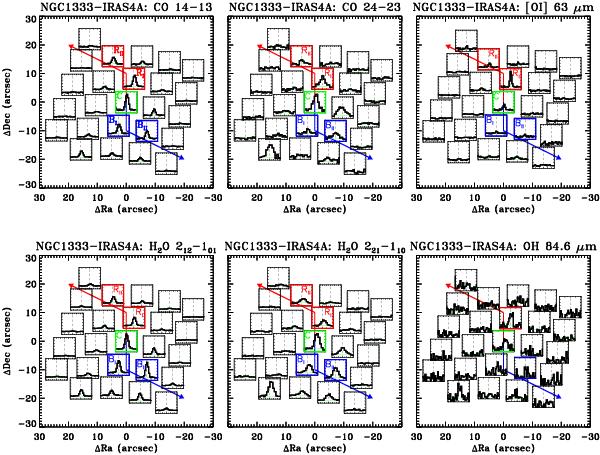
PACS spectral maps of the Class 0 source NGC 1333-IRAS4A in the CO 14–13, CO 24–23, [O i] 63.2 μm, H2O 212–101, H2O 221–110 and OH 84.6 μm lines. The center of each spaxel box corresponds to its position on the sky with respect to the pointed source coordinates from van Dishoeck et al. (2011); shown boxes are smaller than the actual spaxel sizes. Wavelengths in microns are translated to the velocity scale on the X-axis using laboratory wavelengths of the species and cover the range from –550 to 550 km s-1, except for the OH 84.6 μm lines where –400 to 400 km s-1 is shown. The Y-axis shows fluxes normalized to the brightest spaxel on the map separately for each species in a range –0.2 to 1.2. Outflow directions are drawn in blue and red lines based on CO 6–5 APEX CHAMP+ sub-mm maps (Yıldız et al. 2012, and in prep.) that traces the warm entrained gas (T ~ 100 K). Two red outflow (RI, RII), on-source (C) and blue outflow (BI, BII) spaxels are marked with letters. IRAS4A spectra at those positions in different species are shown in Appendix D. The contribution from NGC 1333-IRAS4B, located at (22.5″, –22.8″) with respect to IRAS4A, is seen in the S-E part of the map.
Current usage metrics show cumulative count of Article Views (full-text article views including HTML views, PDF and ePub downloads, according to the available data) and Abstracts Views on Vision4Press platform.
Data correspond to usage on the plateform after 2015. The current usage metrics is available 48-96 hours after online publication and is updated daily on week days.
Initial download of the metrics may take a while.