Free Access
Fig. F.2
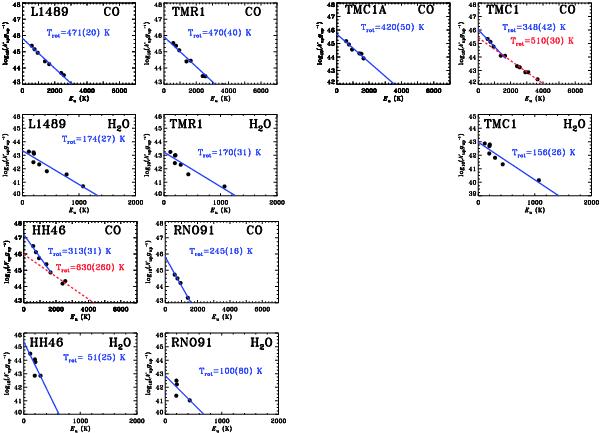
Rotational diagrams of CO H2O for Class I sources. Blue lines show linear fits to the data. The corresponding rotational temperatures are given. Errors associated with the fit are shown in the brackets. Warm components only are seen towards L1489, TMR1 and TMC1A in our diagrams.
Current usage metrics show cumulative count of Article Views (full-text article views including HTML views, PDF and ePub downloads, according to the available data) and Abstracts Views on Vision4Press platform.
Data correspond to usage on the plateform after 2015. The current usage metrics is available 48-96 hours after online publication and is updated daily on week days.
Initial download of the metrics may take a while.