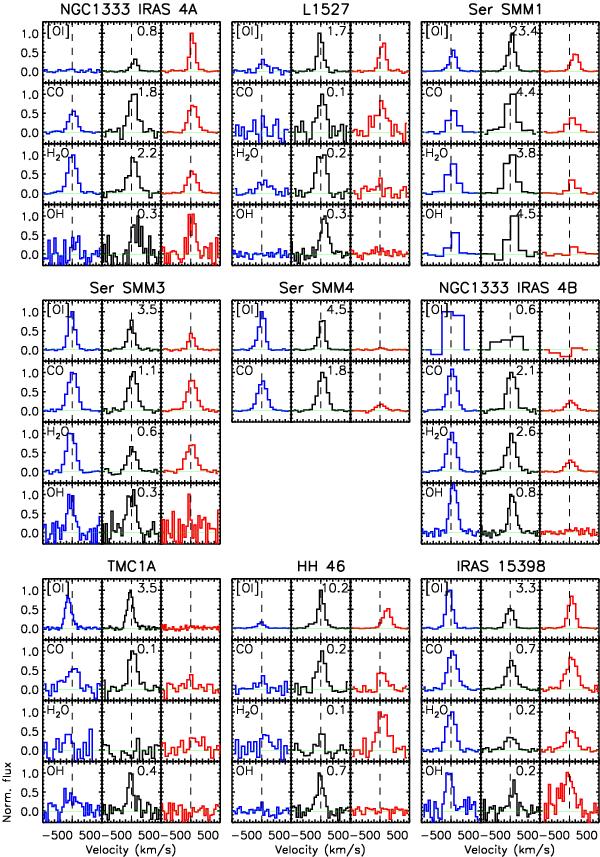
Fig. D.1

Spectra of the [O i] 63.2 μm, CO 14–13 186.0 μm, H2O 212–101 179.5 μm, and OH 84.6 μm lines in the selected blue outflow, on-source and red outflow positions (marked with blue, green and red frames around the spaxels e.g. in Fig. 3) for the extended sources (see Sect. 3.2). The figure shows relative emission at different positions for each species separately. Measured line fluxes at central spaxel position in units of 10-20 W cm-2 are written next to the corresponding spectra.
Current usage metrics show cumulative count of Article Views (full-text article views including HTML views, PDF and ePub downloads, according to the available data) and Abstracts Views on Vision4Press platform.
Data correspond to usage on the plateform after 2015. The current usage metrics is available 48-96 hours after online publication and is updated daily on week days.
Initial download of the metrics may take a while.


