Fig. B.1
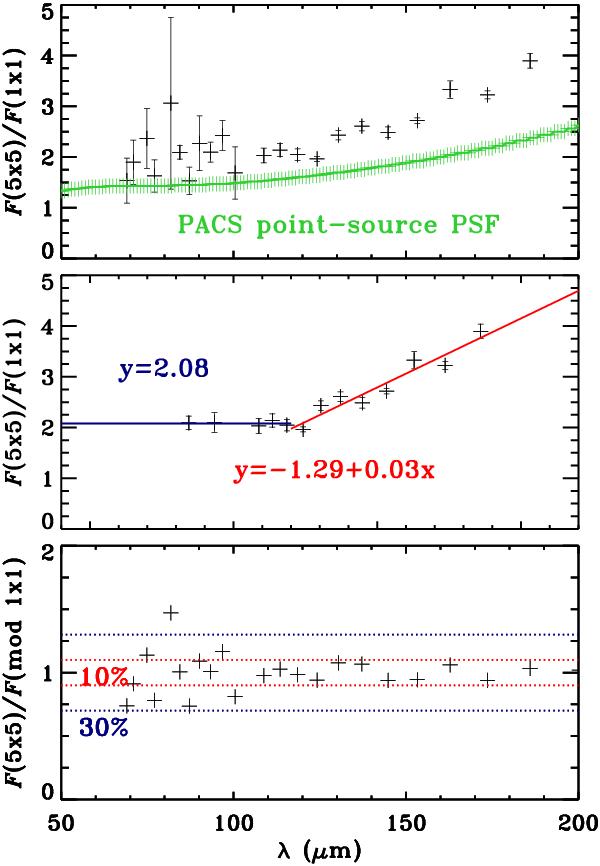
Illustration of the correction curve method. Top: CO fluxes of Serpens SMM1 measured over 5 × 5 array divided by the central spaxel fluxes are plotted versus wavelengths. PACS PSF for a point source is shown in green. CO emission is clearly extended for this sources. Middle: best signal-to-noise measurements are used to make a fit to the data and derive the wavelength-dependent correction factors. Bottom: CO fluxes measured over 5 × 5 array are divided by central spaxel measurements corrected for the extended emission using calculated correction factors are plotted versus wavelength. Accuracy longward ~100 μm is better than 10%, whereas the accuracy is ~30% for short-wavelength lines (≤100 μm).
Current usage metrics show cumulative count of Article Views (full-text article views including HTML views, PDF and ePub downloads, according to the available data) and Abstracts Views on Vision4Press platform.
Data correspond to usage on the plateform after 2015. The current usage metrics is available 48-96 hours after online publication and is updated daily on week days.
Initial download of the metrics may take a while.