Free Access
Fig. 14
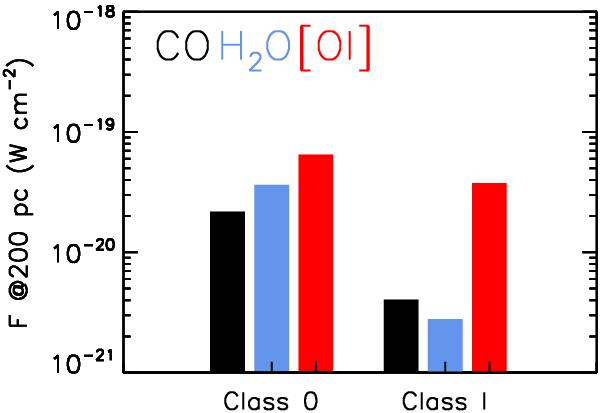
Median line flux of the CO 14–13, H2O 212–101, and [O i]  lines for Class 0 and I objects from our sample are shown from left to right for each class in black, blue and red, respectively.
Current usage metrics show cumulative count of Article Views (full-text article views including HTML views, PDF and ePub downloads, according to the available data) and Abstracts Views on Vision4Press platform.
Data correspond to usage on the plateform after 2015. The current usage metrics is available 48-96 hours after online publication and is updated daily on week days.
Initial download of the metrics may take a while.