Free Access
Fig. 10
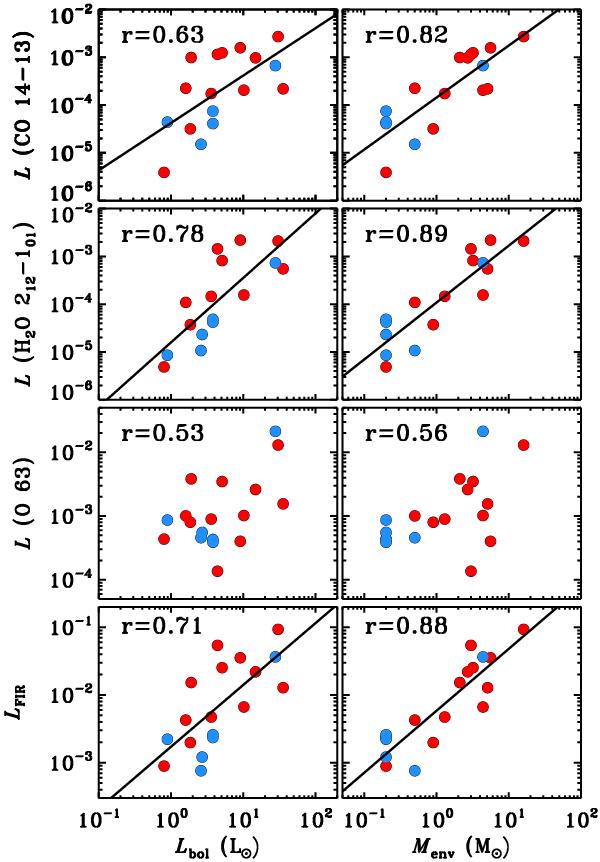
Correlations of full array line emission with bolometric luminosity (left column) and envelope mass (right column) from top to bottom: CO 14–13, H2O 212–101, [O i] at 63.2 μm line luminosities, and total far-IR gas cooling LFIR.
Current usage metrics show cumulative count of Article Views (full-text article views including HTML views, PDF and ePub downloads, according to the available data) and Abstracts Views on Vision4Press platform.
Data correspond to usage on the plateform after 2015. The current usage metrics is available 48-96 hours after online publication and is updated daily on week days.
Initial download of the metrics may take a while.