Fig. 1
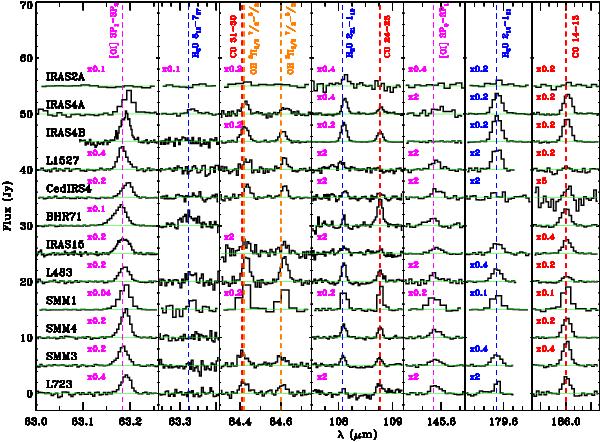
Line survey of Class 0 sources at the on-source position. Spectra are extracted from the central spaxel only for the well-pointed sources (for mispointed sources see text) and continuum subtracted. No correction for point spread function is made. Dashed lines show laboratory wavelengths of [O i] (pink), OH (orange), CO (red), and H2O (blue). BHR71 and Ser SMM4 were not observed in all the lines within our program (see text).
Current usage metrics show cumulative count of Article Views (full-text article views including HTML views, PDF and ePub downloads, according to the available data) and Abstracts Views on Vision4Press platform.
Data correspond to usage on the plateform after 2015. The current usage metrics is available 48-96 hours after online publication and is updated daily on week days.
Initial download of the metrics may take a while.