Fig. 3
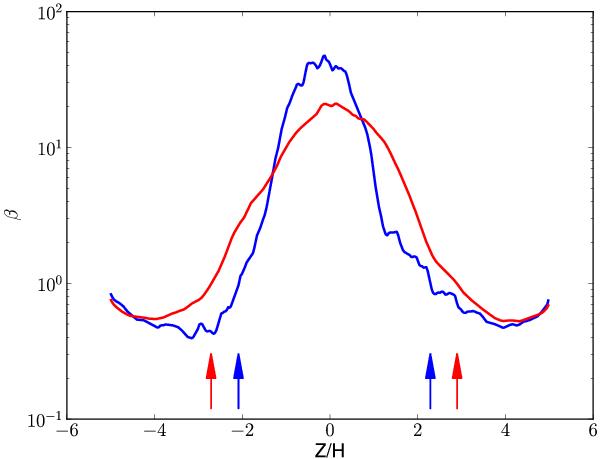
Vertical profile of the ratio β between the horizontally averaged thermal pressure and the horizontally averaged magnetic pressure. The blue curve corresponds to model Diffu1H and results from a further time average between t = 10 and t = 15 orbits. The red curve was obtained averaging the data of model Diffu4H between t = 10 and t = 30. For each model, the vertical arrows report the approximate wind launching location where β = 1 (SI09).
Current usage metrics show cumulative count of Article Views (full-text article views including HTML views, PDF and ePub downloads, according to the available data) and Abstracts Views on Vision4Press platform.
Data correspond to usage on the plateform after 2015. The current usage metrics is available 48-96 hours after online publication and is updated daily on week days.
Initial download of the metrics may take a while.