Fig. 7
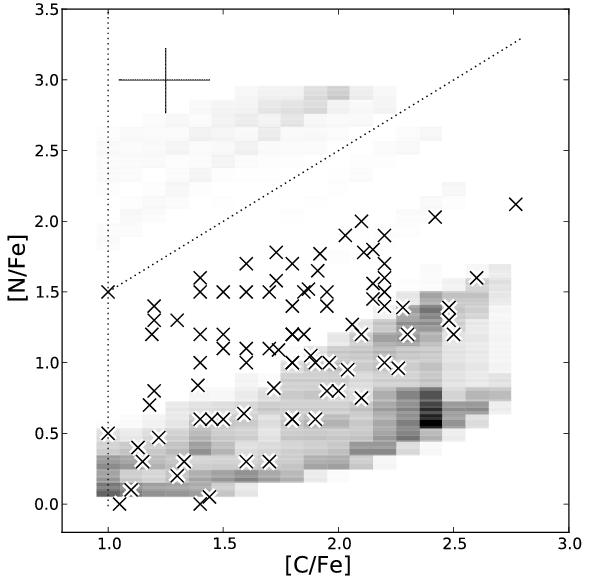
Distribution of [N/Fe] vs. [C/Fe] in the CEMP population predicted by γ2-model set Eq with q-dependent WRLOF. Darker grey indicates greater density of stars. Crosses are data from our selection of SAGA database. Average error bars of the observations are shown in the top-left corner. CEMP stars appear to the right of the vertical dotted line. CNEMP stars enhanced both in carbon and nitrogen appear above the diagonal dotted line.
Current usage metrics show cumulative count of Article Views (full-text article views including HTML views, PDF and ePub downloads, according to the available data) and Abstracts Views on Vision4Press platform.
Data correspond to usage on the plateform after 2015. The current usage metrics is available 48-96 hours after online publication and is updated daily on week days.
Initial download of the metrics may take a while.