Fig. 6
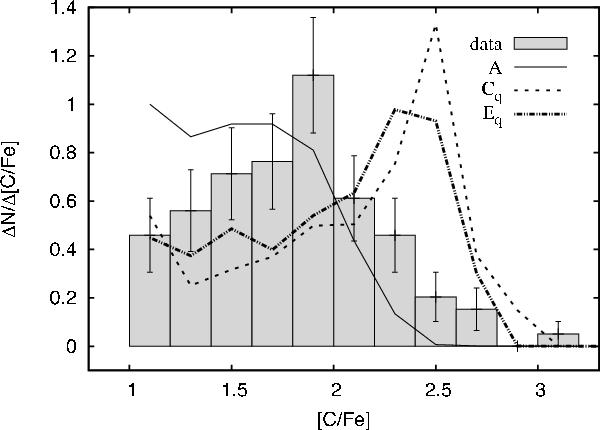
Distribution of [C/Fe] in the CEMP population. The histogram shows the observed distribution in our data sample, with Poisson errors. The solid, dotted and dot-dashed lines are model sets A, Cq and Eq respectively. Model set A is our default, Cq and Eq are the models for q-dependent WRLOF. Model set Cq assumes a spherically symmetric wind. Model set Eq is calculated with γ = 2 in Eq. (10).
Current usage metrics show cumulative count of Article Views (full-text article views including HTML views, PDF and ePub downloads, according to the available data) and Abstracts Views on Vision4Press platform.
Data correspond to usage on the plateform after 2015. The current usage metrics is available 48-96 hours after online publication and is updated daily on week days.
Initial download of the metrics may take a while.