Fig. 4
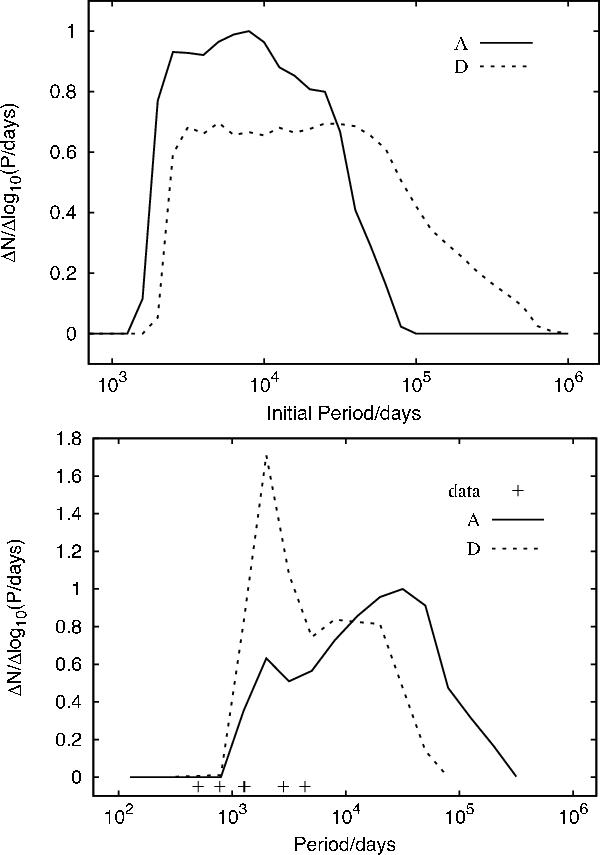
Initial (top panel) and final (bottom panel) period distributions of the CEMP population. In model set D (dotted line) angular momentum losses are computed with Eq. (10) and γ = 2. Solid line is the standard model set A. Plus signs are the periods of observed stars. The bins are equally spaced and the width in log 10 (P /days) of each bin is 0.1 (top panel) and 0.2 (bottom panel). In this and in the plots that follow the y-axis indicates the expected number of CEMP stars in each bin and the plots are normalised such that the area under the graph is the same for each model and model A peaks at 1.
Current usage metrics show cumulative count of Article Views (full-text article views including HTML views, PDF and ePub downloads, according to the available data) and Abstracts Views on Vision4Press platform.
Data correspond to usage on the plateform after 2015. The current usage metrics is available 48-96 hours after online publication and is updated daily on week days.
Initial download of the metrics may take a while.