Fig. 9
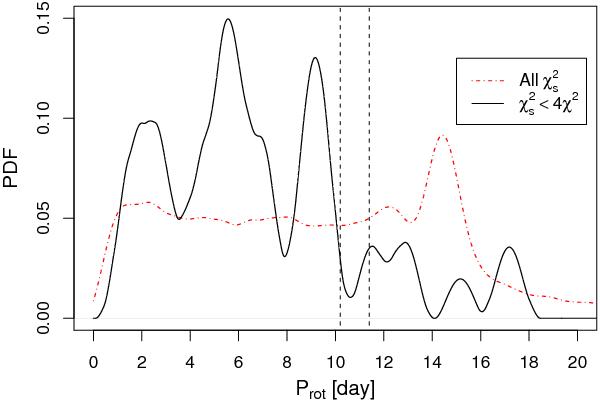
Probability Distribution Function of the period Prot as recovered from 10 000 realizations by time-shuffling, considering all the cases (solid black line) or the realizations returning a  lower than 4 times the best-fit χ2 for Model A (dot-dashed red line; see Sect. 2.2.4). The dashed vertical lines bracket the 3σ interval around the best-fit period of 10.8 days.
Current usage metrics show cumulative count of Article Views (full-text article views including HTML views, PDF and ePub downloads, according to the available data) and Abstracts Views on Vision4Press platform.
Data correspond to usage on the plateform after 2015. The current usage metrics is available 48-96 hours after online publication and is updated daily on week days.
Initial download of the metrics may take a while.