Fig. 3
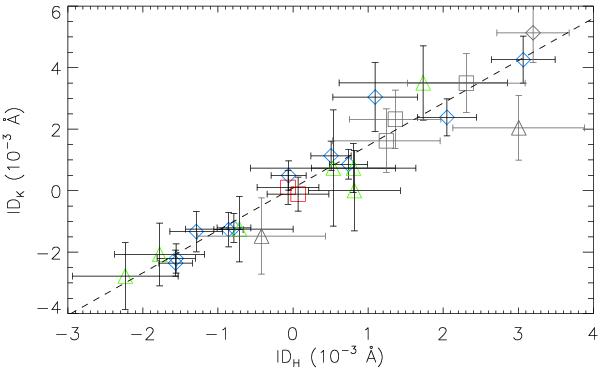
Correlation between the IDH and IDK indicators. Blue diamonds, green triangles and red squares correspond to ESPaDOnS, SARG and du Pont measurements, respectively. The dashed line is the outlier-resistant best fit of the trend. Symbols in gray correspond to spectra collected during three days characterized by an enhanced activity level, including a prominent X-ray flare (see Sect. 3), that were not included in the correlation analysis.
Current usage metrics show cumulative count of Article Views (full-text article views including HTML views, PDF and ePub downloads, according to the available data) and Abstracts Views on Vision4Press platform.
Data correspond to usage on the plateform after 2015. The current usage metrics is available 48-96 hours after online publication and is updated daily on week days.
Initial download of the metrics may take a while.