Fig. 2
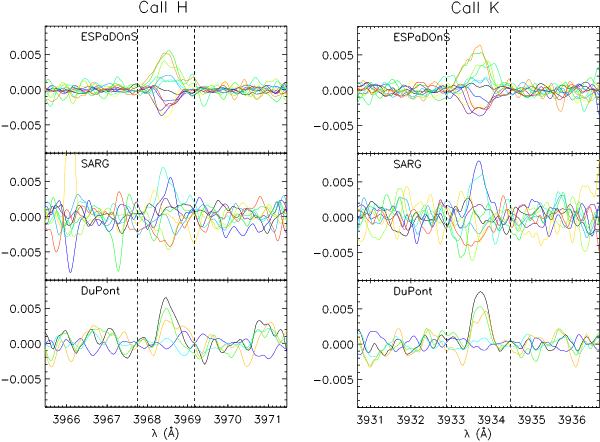
Deviations from the Ca ii H (left column) and K (right column) average spectrum, for the ESPaDOnS, SARG and du Pont series of spectra (from top to bottom, respectively). In each panel, colors code the different nights of observations. The vertical dashed lines delimit the core of the lines, as assumed in the present analysis (see the text).
Current usage metrics show cumulative count of Article Views (full-text article views including HTML views, PDF and ePub downloads, according to the available data) and Abstracts Views on Vision4Press platform.
Data correspond to usage on the plateform after 2015. The current usage metrics is available 48-96 hours after online publication and is updated daily on week days.
Initial download of the metrics may take a while.