Fig. 16
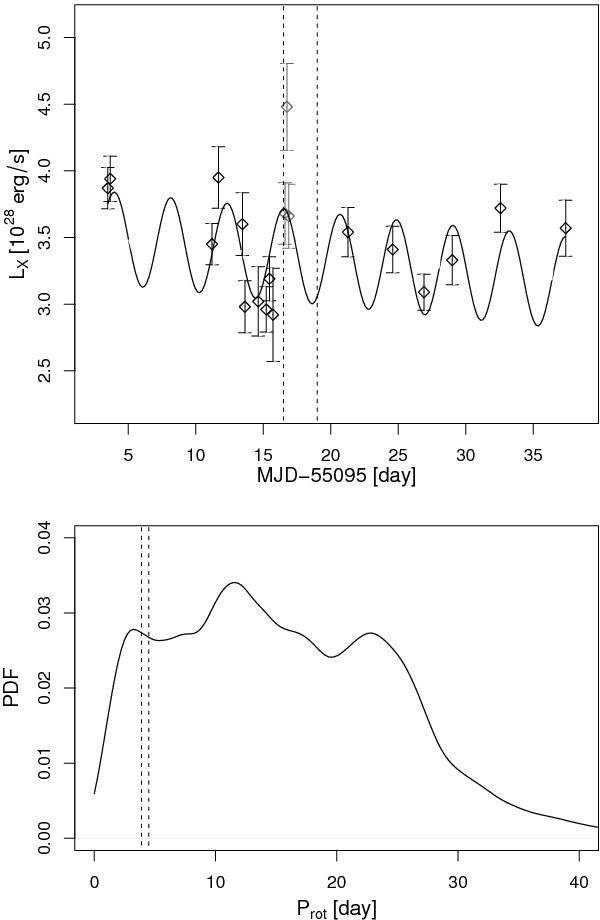
Top panel – Best fit of the X-ray light curve, using a linear term and one sinusoidal modulation. The vertical dotted lines bracket the time range likely contaminated by the flare activity and excluded in the fitting, as discussed in Sect. 2.2.2. The fitted period is P = 4.2 ± 0.1 days. Bottom panel – Probability Distribution Function of the fitted periods recovered after 10 000 time shufflings. The FAP is ~2%.
Current usage metrics show cumulative count of Article Views (full-text article views including HTML views, PDF and ePub downloads, according to the available data) and Abstracts Views on Vision4Press platform.
Data correspond to usage on the plateform after 2015. The current usage metrics is available 48-96 hours after online publication and is updated daily on week days.
Initial download of the metrics may take a while.