Fig. 14
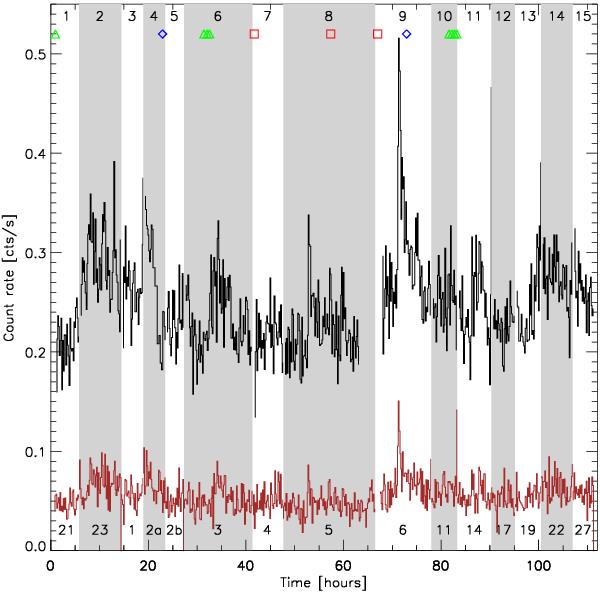
X-ray light curves for the 15 XMM-Newton observations (numbered on top), artificially joined in time, with dates in September and October 2009 indicated at the bottom. The cumulative exposure time since the start of the first observation is reported in abscissa. The upper (black) curve shows the pn count rate, while the lower (red) curve refers to the mos1 detector. All time bins have the same nominal duration of 600 s. The symbols on top indicate the strictly simultaneous optical spectroscopy (triangles for SARG, squares for du Pont, diamonds for ESPaDOnS observations).
Current usage metrics show cumulative count of Article Views (full-text article views including HTML views, PDF and ePub downloads, according to the available data) and Abstracts Views on Vision4Press platform.
Data correspond to usage on the plateform after 2015. The current usage metrics is available 48-96 hours after online publication and is updated daily on week days.
Initial download of the metrics may take a while.