Free Access
Fig. 13
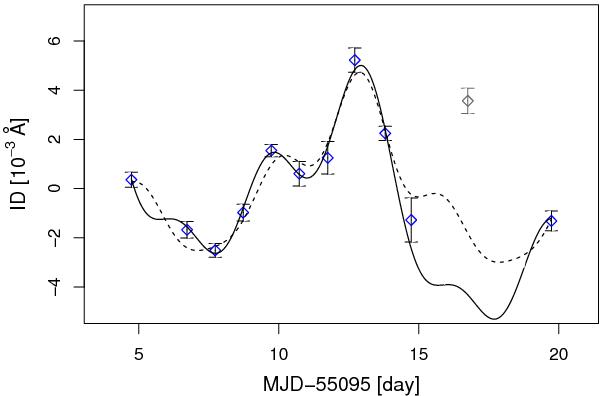
Best-fit (solid line) for the ID proxy of the Ca ii IRT with Eq. (1) Model A, compared with the best-fit of the H&K data (dashed line, see text for more details). The gray symbol represents the data point not included in the fitting procedure, being likely contaminated by the flare activity as discussed in Sect. 3.
Current usage metrics show cumulative count of Article Views (full-text article views including HTML views, PDF and ePub downloads, according to the available data) and Abstracts Views on Vision4Press platform.
Data correspond to usage on the plateform after 2015. The current usage metrics is available 48-96 hours after online publication and is updated daily on week days.
Initial download of the metrics may take a while.