Fig. 12
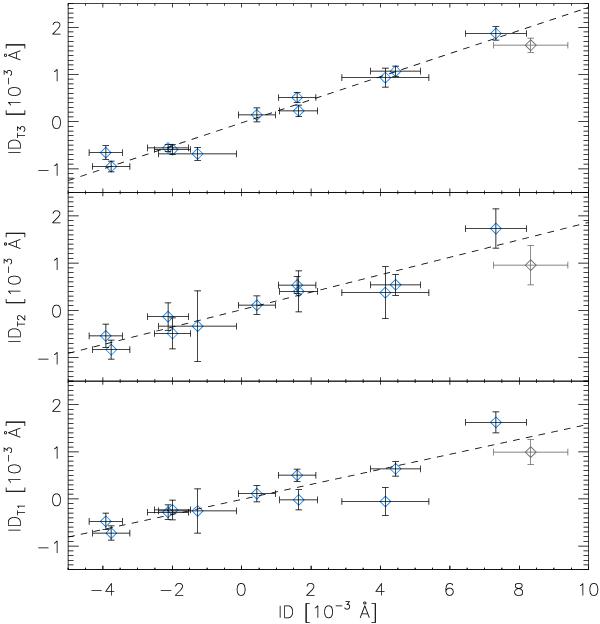
Correlation between the co-added ID of the H&K lines and the IDs of the three lines in the Ca ii IRT (T1, T2, and T3, from bottom to top). In each panel, the dashed line is the outlier-resistant best fit of the trend (Pearson’s coefficient always ≳0.9). Symbols in gray correspond to the spectra collected during the flaring interval indicated by the X-ray observations (Sect. 3), and not included in the correlation analysis.
Current usage metrics show cumulative count of Article Views (full-text article views including HTML views, PDF and ePub downloads, according to the available data) and Abstracts Views on Vision4Press platform.
Data correspond to usage on the plateform after 2015. The current usage metrics is available 48-96 hours after online publication and is updated daily on week days.
Initial download of the metrics may take a while.