Free Access
Fig. 11
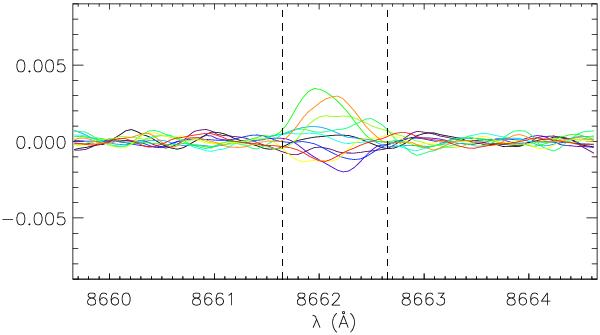
Deviations from the average spectrum of the λ8662 Å line. Colors code the different nights of observations. The vertical dashed lines delimit the core of the lines, as assumed in the present analysis.
Current usage metrics show cumulative count of Article Views (full-text article views including HTML views, PDF and ePub downloads, according to the available data) and Abstracts Views on Vision4Press platform.
Data correspond to usage on the plateform after 2015. The current usage metrics is available 48-96 hours after online publication and is updated daily on week days.
Initial download of the metrics may take a while.