Free Access
Fig. 4
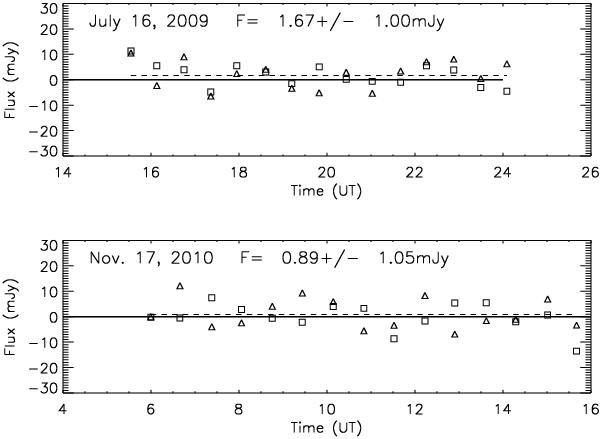
Time series of the 150 MHz flux density measured in the direction of one comparison source at α = 19h50m32.2s, δ = +48°04′22′′ (J2000), at 183′′ from HAT-P-11. The dashed horizontal lines show the mean values of flux density at the two observation epochs.
Current usage metrics show cumulative count of Article Views (full-text article views including HTML views, PDF and ePub downloads, according to the available data) and Abstracts Views on Vision4Press platform.
Data correspond to usage on the plateform after 2015. The current usage metrics is available 48-96 hours after online publication and is updated daily on week days.
Initial download of the metrics may take a while.