Fig. 1
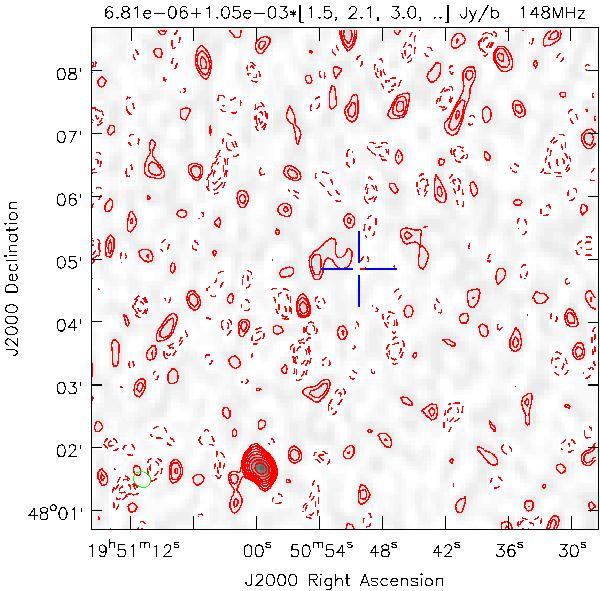
GMRT image of the HAT-P-11 field at 150 MHz on July 16, 2009. The green ellipse in the lower-left corner shows the half-power beam width. The contour levels given at the top of the image are in units of Jy beam-1 and are defined as mean + rms × (n), where values of n are given in the brackets. Thus, the first, second, and third contours correspond to 1.5 × 1.05 mJy, 2.1 × 1.05 mJy, 3.0 × 1.05 mJy, etc. Negative contours appear as dashed lines.
Current usage metrics show cumulative count of Article Views (full-text article views including HTML views, PDF and ePub downloads, according to the available data) and Abstracts Views on Vision4Press platform.
Data correspond to usage on the plateform after 2015. The current usage metrics is available 48-96 hours after online publication and is updated daily on week days.
Initial download of the metrics may take a while.