Fig. 9
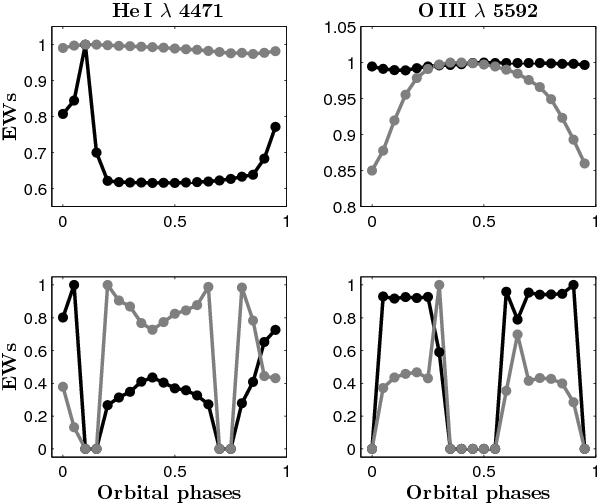
Example of EW variations for the He I λ 4471 line for model E2 and for the O III λ 5592 line for model E4. The EWs have been normalized to the highest value. Black: primary. Grey: secondary. Top: variations measured on individual spectra (EWp,max,HeI = 0.17 Å, EWp,max,OIII = 0.18 Å, EWs,max,HeI = 0.34 Å, EWs,max,OIII = 0.11 Å). Bottom: variations measured on combined spectra (EWp,max,HeI = 0.17 Å, EWp,max,OIII = 0.14 Å, EWs,max,HeI = 0.10 Å, EWs,max,OIII = 0.08 Å).
Current usage metrics show cumulative count of Article Views (full-text article views including HTML views, PDF and ePub downloads, according to the available data) and Abstracts Views on Vision4Press platform.
Data correspond to usage on the plateform after 2015. The current usage metrics is available 48-96 hours after online publication and is updated daily on week days.
Initial download of the metrics may take a while.