Fig. 8
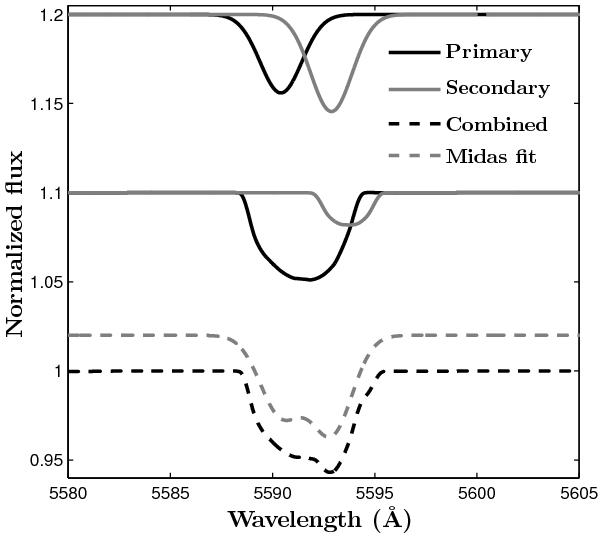
Combination of the O III λ5592 line of the primary and the secondary for model E2 at phase 0.25. The deblend/line routine will not fit the line of the secondary properly. Top: the resulting lines of the two Gaussian fits. Middle: individual lines of the primary and secondary computed with our model and normalized to the continuum of the entire system. Bottom: spectrum of the system and corresponding fit of MIDAS.
Current usage metrics show cumulative count of Article Views (full-text article views including HTML views, PDF and ePub downloads, according to the available data) and Abstracts Views on Vision4Press platform.
Data correspond to usage on the plateform after 2015. The current usage metrics is available 48-96 hours after online publication and is updated daily on week days.
Initial download of the metrics may take a while.