Fig. 1
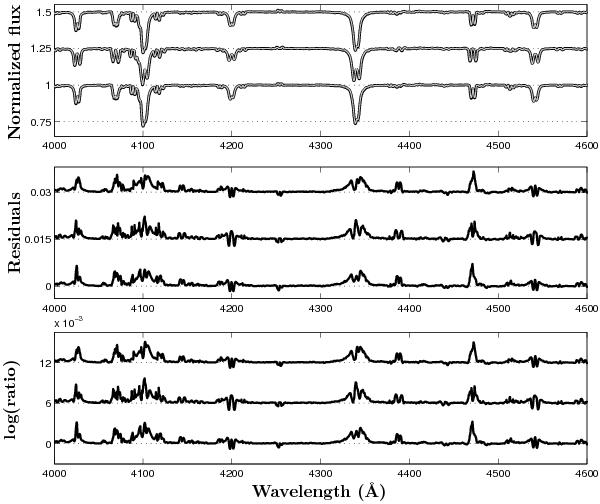
Top: comparison between the normalized spectra computed without radiation pressure (in black) and with radiation pressure (in grey) for model 1. To better distinguish spectra, the black line is wider than the grey line. Orbital phases are, from bottom to top: phases 0.1, 0.25 and 0.4. The spectra are shifted vertically by 0.25 continuum units for clarity. Middle: corresponding residuals (spectrum with radiation pressure minus spectrum without radiation pressure). The residual plots are shifted by 0.015 for clarity. Bottom: logarithm of the ratio of the fluxed spectra with radiation pressure divided by the one without. These plot are shifted by 0.006 for clarity.
Current usage metrics show cumulative count of Article Views (full-text article views including HTML views, PDF and ePub downloads, according to the available data) and Abstracts Views on Vision4Press platform.
Data correspond to usage on the plateform after 2015. The current usage metrics is available 48-96 hours after online publication and is updated daily on week days.
Initial download of the metrics may take a while.