Fig. 4
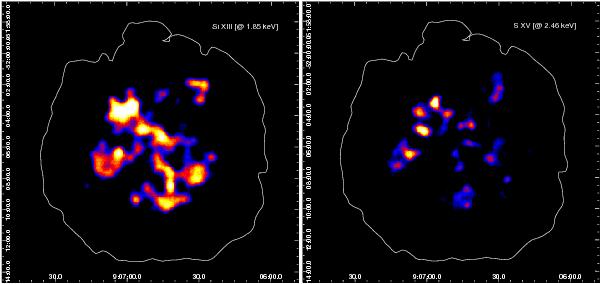
Vignetting-corrected XMM-Newton images of Si xiii (1.85 keV), and S xv (2.4 keV). Both images were produced by following the same analysis that was used in Fig. 1. Observed X-ray emission from line elements are three sigmas above local background. White contours indicate the peripheral edge of total X-ray emission of G272.2−3.2.
Current usage metrics show cumulative count of Article Views (full-text article views including HTML views, PDF and ePub downloads, according to the available data) and Abstracts Views on Vision4Press platform.
Data correspond to usage on the plateform after 2015. The current usage metrics is available 48-96 hours after online publication and is updated daily on week days.
Initial download of the metrics may take a while.