Fig. 1

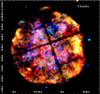
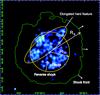
Left panel: Chandra image, covering a 16×16 arcmin2 field of view, of G272.2−3.2 in the three X-ray energy bands: soft (0.5−1.0 keV) in red, medium (1.0−1.8 keV) in green, and hard (1.8−3.0 keV) in blue. The image corresponds to the merged Chandra observations. Right panel: combined XMM-Newton MOS1 and MOS2 image in the hard X-ray energy range (1.8−3.0 keV). The boundary of the SNR is indicated in yellow. The circle in the central part of the SNR indicates the reverse shock interface. The region of the elongated hard emission is also indicated by a yellow ellipse. RCD and RS indicate the radii of the contact discontinuity and the forward shock front, respectively. Horizontal and vertical axes are labeled using J2000.0 right ascension and declination.
Current usage metrics show cumulative count of Article Views (full-text article views including HTML views, PDF and ePub downloads, according to the available data) and Abstracts Views on Vision4Press platform.
Data correspond to usage on the plateform after 2015. The current usage metrics is available 48-96 hours after online publication and is updated daily on week days.
Initial download of the metrics may take a while.