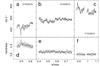
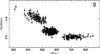
Fig. 5

Intensity (top) and hardness ratio (middle) curves during three RXTE/PCA observations (day 7.1: a), d), respectively; day 9.1: b), e), respectively; day 12.7: c), f), respectively), using PCU2 data at a time resolution of 16 s. The light curves are for the 2–60 keV band, whilst the hardness is defined as the ratio of the count rates in the 4.9–9.8 keV and 2.1–4.9 keV bands. The curves are folded on the absorption dipping activity ephemeris (see Sect. 3.3). Bottom: hardness versus intensity diagram (HID) for the same three observations. Day 7.1: filled circles; day 9.1: filled triangles; day 12.7: filled squares).
Current usage metrics show cumulative count of Article Views (full-text article views including HTML views, PDF and ePub downloads, according to the available data) and Abstracts Views on Vision4Press platform.
Data correspond to usage on the plateform after 2015. The current usage metrics is available 48-96 hours after online publication and is updated daily on week days.
Initial download of the metrics may take a while.