Fig. 3
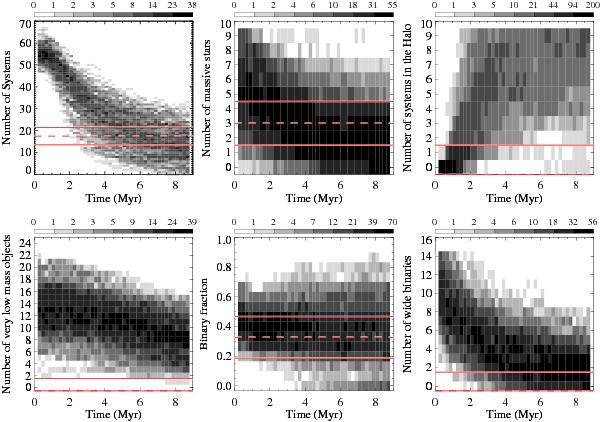
3D histograms showing the evolution of a) the number of systems in the core N1; b) the number of massive stars in the core N2; c) the number of systems in the halo N3; d) the number of VLMOs inside a 2.6 pc radius N4; e) the binary fraction in the core N5; and f) the number of wide (separation greater than 50 AU) binaries N6 as a function of time for model A and for the initial configuration {Nsys = 40, RPl = 0.05 pc, Qi = 0.5}. The histogram density corresponds to the number of simulations (out of 200) that fall in a given bin. The dashed and solid red lines correspond to the observed value and the acceptable range respectively.
Current usage metrics show cumulative count of Article Views (full-text article views including HTML views, PDF and ePub downloads, according to the available data) and Abstracts Views on Vision4Press platform.
Data correspond to usage on the plateform after 2015. The current usage metrics is available 48-96 hours after online publication and is updated daily on week days.
Initial download of the metrics may take a while.