Fig. 3
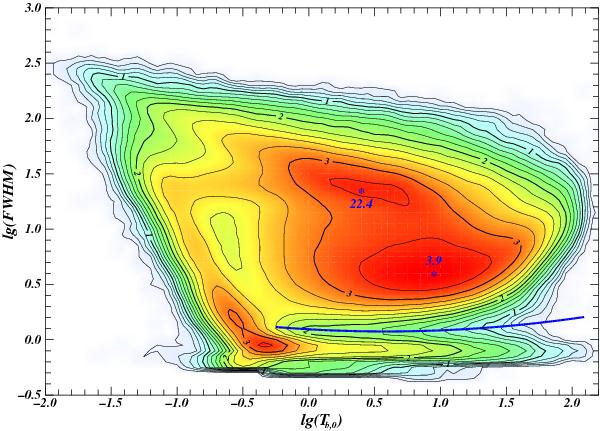
Frequency distribution of the parameter values in the (lg(Tb,0),lg(FWHM)) plane for all Gaussians obtained in the decomposition of the LAB. Isodensity lines are drawn in the scale of lg(N + 1) with the interval of 0.2. The two main maxima, corresponding to WNM and CNM are labeled with the values of corresponding Gaussian FWHM. The blue thick solid line represents the selection criterion defined by Eq. (4) of Haud & Kalberla (2006).
Current usage metrics show cumulative count of Article Views (full-text article views including HTML views, PDF and ePub downloads, according to the available data) and Abstracts Views on Vision4Press platform.
Data correspond to usage on the plateform after 2015. The current usage metrics is available 48-96 hours after online publication and is updated daily on week days.
Initial download of the metrics may take a while.