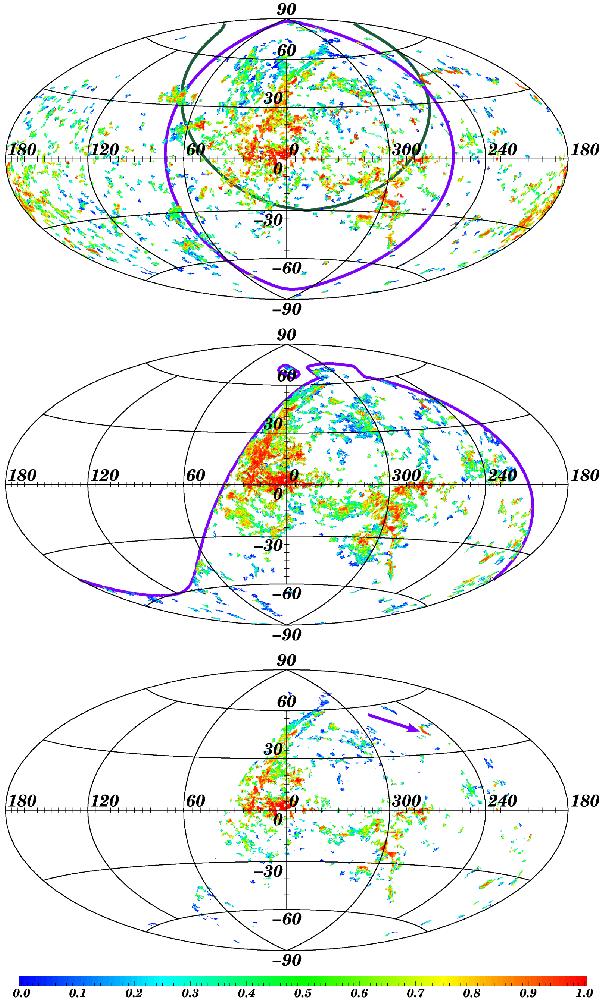
Fig. 2

NHIE clouds from the LAB (upper panel), from the GASS (middle panel) and from both (lower panel). Every Gaussian, belonging to a NHIE cloud candidate, is represented with the color, corresponding to the sequence number of this component in the ascending list of the values of Tb,0/FWHM2 of these Gaussians. The red color corresponds to the highest values of Tb,0/FWHM2. The numbers at the color scale below the figure denote the fractions of the length of the list. The thick lines in the upper panel indicate the location of the expanding superbubble shells S1 (dark violet) and S2 (sea green). In the middle panel, the border of the region covered by the GASS is indicated. The arrow on the lower panel points to the cloud with the narrowest lines, reliably detected in both, the LAB and GASS.
Current usage metrics show cumulative count of Article Views (full-text article views including HTML views, PDF and ePub downloads, according to the available data) and Abstracts Views on Vision4Press platform.
Data correspond to usage on the plateform after 2015. The current usage metrics is available 48-96 hours after online publication and is updated daily on week days.
Initial download of the metrics may take a while.


