Fig. 1
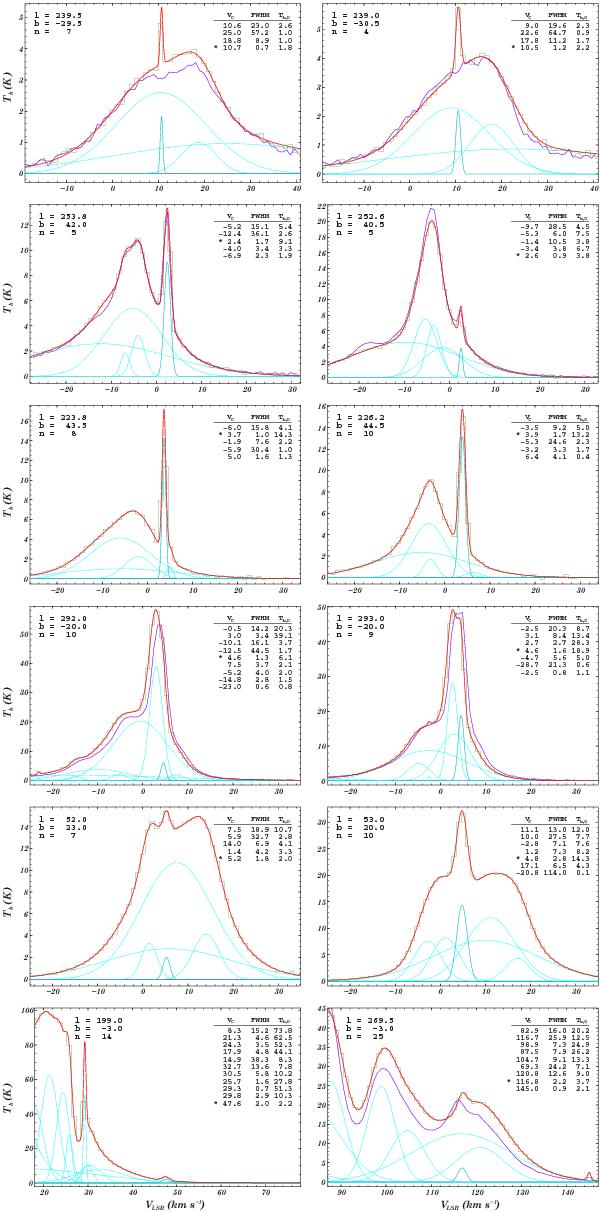
Examples of profile fragments with narrow components. The observed LAB profiles are plotted by green stepped lines, individual Gaussian components by turquoise thin smooth lines and the Gaussian representations of the profiles by red thick smooth lines. The dark violet piecewise linear lines represent the GASS observations. The numerical data in the upper left corner of each panel give the Galactic coordinates and the total number of Gaussians for this profile. In the upper right corner are given the parameters of Gaussians, contributing to the model profile in the velocity range of the figure. The Gaussian component, belonging to the cloud under discussion, is drawn by a thicker dark turquoise line near the center of the velocity axis of each panel and marked with an asterisk in the table of Gaussian parameters. Row 1: the cloud candidate with the narrowest average line width. Row 2: the ring cloud with the narrowest average line width. Row 3: Verschuur’s cloud A. Row 4: heavily blended components. Row 5: profiles from the comet-like structure, discussed in Sect. 3. Row 6: two clouds at higher velocities near the Galactic plane, used for Fig. 4.
Current usage metrics show cumulative count of Article Views (full-text article views including HTML views, PDF and ePub downloads, according to the available data) and Abstracts Views on Vision4Press platform.
Data correspond to usage on the plateform after 2015. The current usage metrics is available 48-96 hours after online publication and is updated daily on week days.
Initial download of the metrics may take a while.