Fig. 2
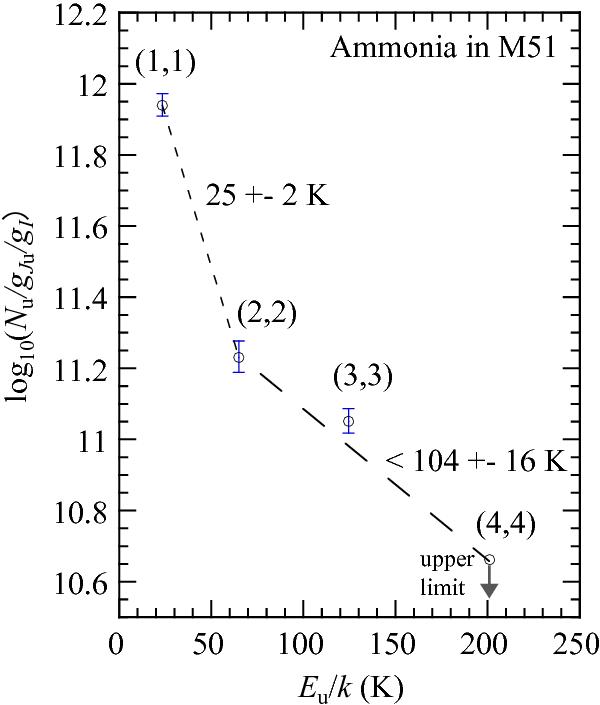
Rotational diagram of ammonia in M 51. The horizontal axis is the upper state energy, and the vertical axis corresponds to the abundances (gJu = 2Jupper + 1, gI is the spin statistical weight). The (4, 4) line is regarded as an upper limit, because it is barely detected. The error of each data point was estimated based on the noise level of each spectrum. About the rotational diagram analysis, see the section of results and references there.
Current usage metrics show cumulative count of Article Views (full-text article views including HTML views, PDF and ePub downloads, according to the available data) and Abstracts Views on Vision4Press platform.
Data correspond to usage on the plateform after 2015. The current usage metrics is available 48-96 hours after online publication and is updated daily on week days.
Initial download of the metrics may take a while.