Fig. 4
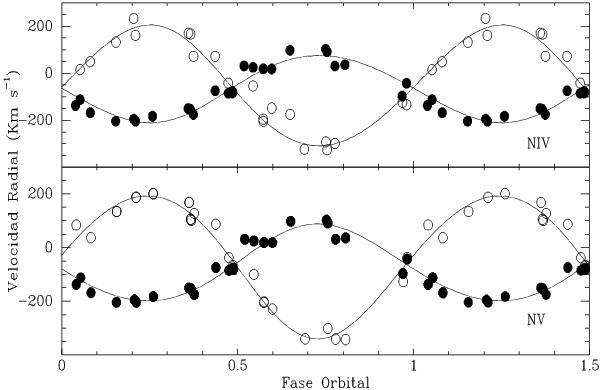
The RV curves for both components in WR62a. The open circles show the RVs for N ivλ4058 Å and N vλ4604 Å emission lines. The filled circles show the mean RVs of some absorption lines for the secondary one. RVs of the emission lines were shifted to match the systemic velocity derived from the absorption lines alone (see text). The ephemeris given in Eq. (1) was used to generate the RV curves.
Current usage metrics show cumulative count of Article Views (full-text article views including HTML views, PDF and ePub downloads, according to the available data) and Abstracts Views on Vision4Press platform.
Data correspond to usage on the plateform after 2015. The current usage metrics is available 48-96 hours after online publication and is updated daily on week days.
Initial download of the metrics may take a while.