Fig. 2
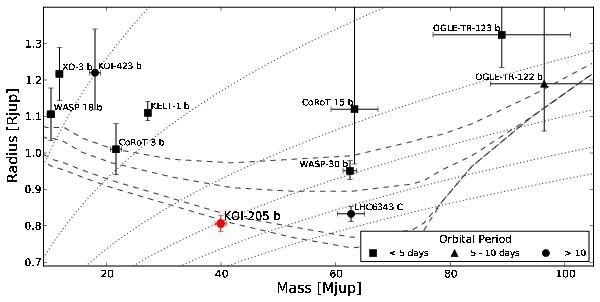
Mass radius diagram including transiting companions more massive than 10 MJup. The dashed curves are the Baraffe et al. (2003) isochrones for (from top to bottom) 0.5, 1, 5, and 10 gigayears. The dotted lines are the isodensity curves for 10, 25, 50, 75, 100, and 125 times the mean density of Jupiter. (Data from: Siverd et al. 2012; Triaud et al. 2013; Bouchy et al. 2011b,a; Johnson et al. 2011; Hellier et al. 2009; Deleuil et al. 2008; Winn et al. 2008; Pont et al. 2005, 2006.)
Current usage metrics show cumulative count of Article Views (full-text article views including HTML views, PDF and ePub downloads, according to the available data) and Abstracts Views on Vision4Press platform.
Data correspond to usage on the plateform after 2015. The current usage metrics is available 48-96 hours after online publication and is updated daily on week days.
Initial download of the metrics may take a while.