Fig. 2
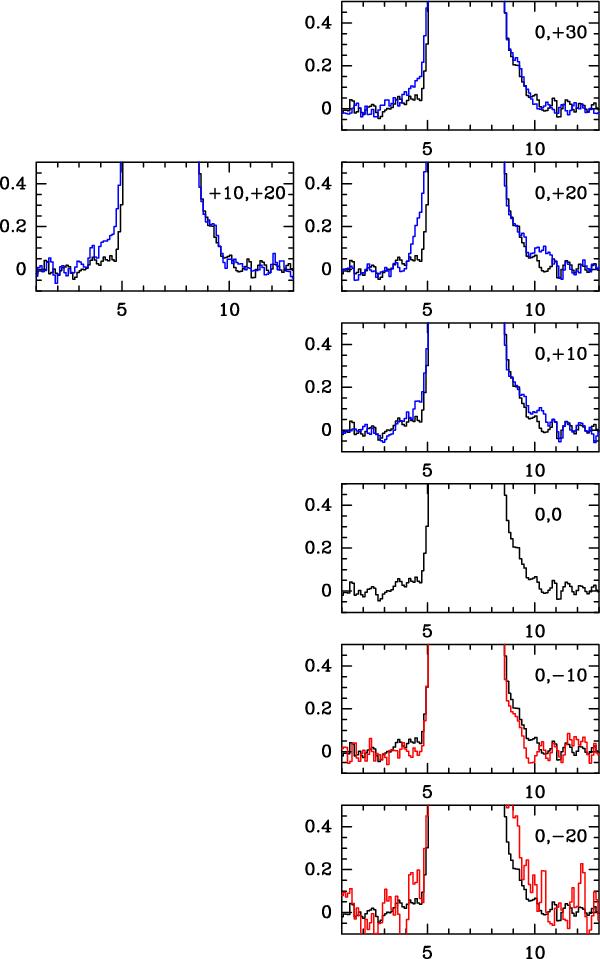
Montage of some of the CO(2−1) emission line profiles observed for FU Tau shown with a zoom on the region of the wings. The central (0,0) position spectrum is repeated as a dark solid line in all the plots, superimposed on the lines observed at the other positions, in color. We detect excess emission in the blue-wing between 3 km s-1 and 5 km s-1, at the (0, 20), (10, 20) and (0, 30) positions. This points to a molecular outflow driven by the FU Tau system.
Current usage metrics show cumulative count of Article Views (full-text article views including HTML views, PDF and ePub downloads, according to the available data) and Abstracts Views on Vision4Press platform.
Data correspond to usage on the plateform after 2015. The current usage metrics is available 48-96 hours after online publication and is updated daily on week days.
Initial download of the metrics may take a while.